


Quality Control for pyranometer data
When measuring solar radiation with a pyranometer, it is important to look at the data before accepting the measurements. There are several issues that can result in incorrect data. For instanc; dirt on the sensor dome or structures around the measurement location affect the instrument from time to time. Dirt on the sensor can easily be spotted during routine cleaning of the sensor. Shadows from superstructures will become visible in the data when looking at multiple consecutive days. This note will mainly focus on the events that are not so easily identified, especially frost and dew on the dome of the sensor. Depending on the geographic location, frost and dew events can account for over 10 % of the sunshine duration. Luckily, they can easily be suppressed by heating and ventilating the instrument.
What affects the measurement?
When using a pyranometer for measuring solar radiation, it is important to keep the dome of the instrument clear of any contaminants. Some contaminants are easily spotted during routine cleaning of the instrument. Dust for instance, which can accumulate during longer periods of time and will introduce a continuous offset. However, some contaminants affect the measurement for shorter periods of time, mainly during the morning, and leave no trace behind. This is the case for frost, dew, and possibly snow on the instrument. This note will focus on the formation of frost and dew on the instrument and give a guideline on Quality Control criteria for identifying possible frost and dew periods in the measured data.


Dew
Dew is the deposition of water droplets by condensation of water vapour from the air surrounding the instrument. This will form on the instrument when the temperature of the instrument drops below the dew point temperature. In particular, this happens on clear nights because of the net thermal exchange of the instrument with the colder atmosphere. The colder surface of the instrument cools the surrounding air, and if the humidity is high enough, dew will start to form. This can happen for both positive and negative temperatures. After the sun comes up, the temperature of the instrument increases again. When it rises above the dew point temperature, the dew that was formed on the sensor starts to evaporate. This is why you rarely see dew on a sensor when the sun has been shining for a few hours.

Frost
Frost on the other hand can form on the sensor at any time of the day, although it is more common during the morning, because of the cooling of the instrument during the night. Frost forms on the instrument when the water vapour in the air surrounding the instrument turns into ice crystals without going through the liquid phase. For frost to form on the instrument the temperature has to be below the frost point temperature. It is also possible for frost to form on a sensor if the temperature drops below freezing after dew is already present on the instrument. There is no clear way to distinguish frost formed from water vapour or frozen dew.
In Figure 2 the frost point (red) and dew point (blue) temperatures are plotted as a function of relative humidity for air temperatures of 0 °C (solid) and -10 °C (dashed). Because the frost point temperature is higher than the dew point temperature it is very unlikely that dew will form on an instrument before frost forms if the air temperature is below 0 °C. It is however possible for supercooled water vapour to form dew on a sensor at temperatures below the dew point. If these supercooled droplets afterwards freeze this is usually called rime instead of frost.
How to detect affected data
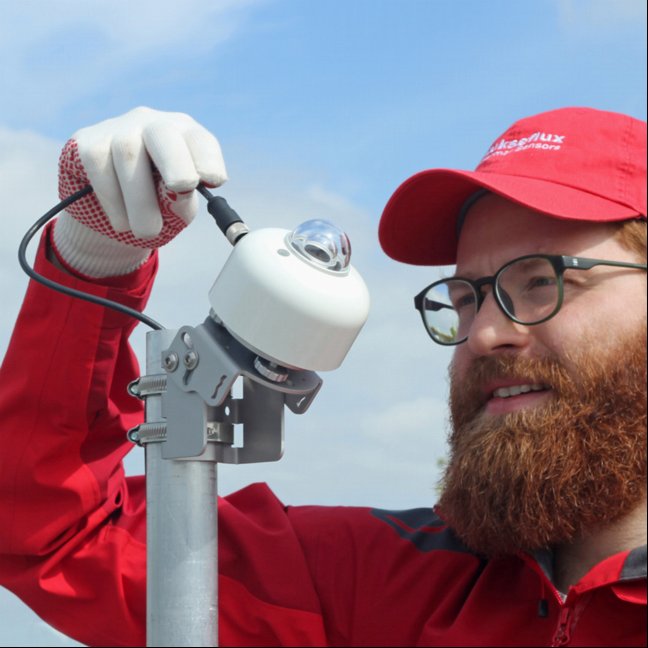
Detecting with 100 % certainty whether an instrument is affected by dew or frost during a certain period can only be done by visually inspecting the instrument.
However, sometimes it is also be possible to identify periods when the measurement was affected by frost or dew from the data. In Figure 4 a typical frost event is visualized, and in Figure 5 a typical dew event. The red line is the measurement from a SR30 in standard operating mode (heated and ventilated) that is unaffected by frost or dew.[1] Purple and orange represent a SR30 in low power mode and a SR20 respectively, both are affected by frost and dew. Green is an estimate of the Global Horizontal Irradiance (GHI) from the Bird model.[2]
All measurements were performed in Delft, the Netherlands. During the morning, structures around the measurement site affect the data as can be seen before 9:00 in Figure 4 and before 8:00 in Figure 5.

Read the full article here: